Intel Arc 140T
Intel Arc 140T: Specifications, Games, Benchmarks, and Differences from Arc 140V
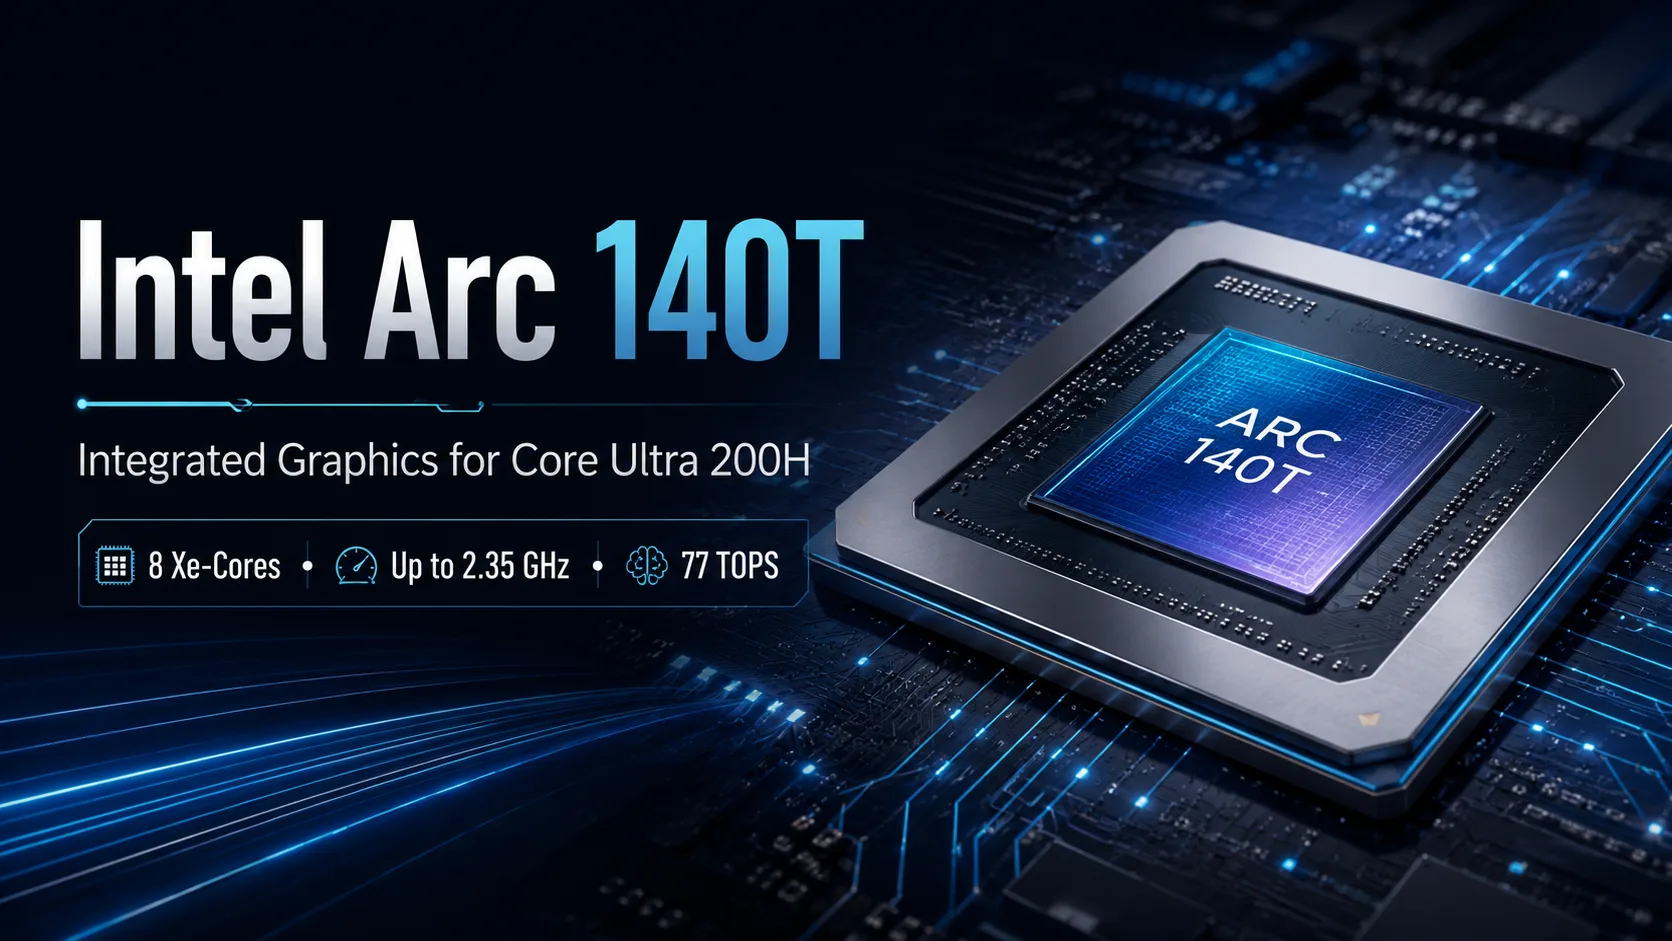
The Intel Arc 140T is integrated graphics for mobile processors in the Core Ultra 200H series. It is a powerful iGPU for versatile laptops: for work, video, light editing, and gaming at 1080p on moderate settings. However, its performance should be assessed based on the specific laptop rather than just the GPU name: memory, cooling, and power limits are important.
What is Intel Arc 140T
The Intel Arc 140T can easily be confused with the Arc 140V from Lunar Lake, but they are different graphics blocks designed for different platforms. The Arc 140T belongs to the Arrow Lake-H series, utilizes shared system memory, and is installed in laptops powered by Core Ultra 200H.
The graphics do not have dedicated video memory. It utilizes memory from the system RAM, so performance depends on memory mode, power, and the manufacturer's laptop configurations.
Key Specifications of Intel Arc 140T
The Arc 140T is significantly more powerful than older integrated solutions from Intel. It features 8 Xe cores, a frequency of up to 2.35 GHz, up to 77 TOPS INT8 on the GPU, and supports DirectX 12.2, OpenGL 4.6, OpenCL 3.0, Quick Sync, and hardware encoding and decoding for AV1.
The mention of "Intel Arc 140T" in laptop specifications does not guarantee consistent performance across different models. In a thin chassis with strict power limits, this graphics unit will behave differently than in a laptop with normal cooling and fast dual-channel memory.
A complete specification table for Intel Arc 140T is provided at the end of the article.
In Which Processors is Intel Arc 140T Used?
The Intel Arc 140T graphics are found in the higher-end Core Ultra 200H processors:
- Intel Core Ultra 5 235H;
- Intel Core Ultra 7 255H;
- Intel Core Ultra 7 265H;
- Intel Core Ultra 9 285H.
The lower-end Core Ultra 5 225H uses the Arc 130T, while some other Core Ultra 200 series utilize standard Intel Graphics. Therefore, when choosing a laptop, it's essential to consider not just the generation of the processor but also the specific graphics block.
Approximate Benchmarks for Intel Arc 140T
The performance of the Arc 140T varies significantly based on the laptop, memory, and power limits. Therefore, the numbers below are indicative rather than guaranteed results for any model.
| Test | Approximate Result for Intel Arc 140T |
|---|---|
| 3DMark Time Spy Score | around 4100 points |
| 3DMark Time Spy Graphics | around 3700-4200 points |
| 3DMark Speed Way | around 550 points |
| 3DMark Steel Nomad | around 800 points |
| Geekbench 6 GPU OpenCL | around 39,500-43,000 points |
| Geekbench 6 GPU Vulkan | around 34,500-35,000 points |
These results place the Arc 140T at the higher end of integrated graphics performance. It is significantly faster than older Iris Xe GPUs and closer to modern iGPUs such as the Arc 140V, Radeon 880M, and Radeon 890M. However, it still falls short compared to entry-level discrete GPUs; heavy games rely not just on synthetic scores but also on power overhead, cooling, and memory bandwidth.
| Metric | What This Means |
|---|---|
| Time Spy Graphics around 3700-4200 | high for iGPU, but lower than entry-level discrete GPUs |
| Geekbench 6 OpenCL around 40,000 | good result for compatible computing tasks |
| Speed Way around 550 | ray tracing is supported, but heavy RT scenarios are not its forte |
| Significant variability between laptops | memory, cooling, and power limits greatly impact the result |
Intel Arc 140T in Comparison to Other GPUs
The Arc 140T should primarily be compared to other strong integrated GPUs. Its direct counterparts are the Arc 140V, Radeon 880M, Radeon 890M, and the Intel Arc 8-Core iGPU from Meteor Lake. Entry-level discrete graphics cards remain a class above.
| Graphics | How to perceive it alongside Arc 140T |
|---|---|
| Intel Iris Xe | noticeably weaker and simpler in capabilities |
| Intel Arc 8-Core iGPU | close predecessor, usually slightly weaker |
| Intel Arc 140V | often better in efficiency, especially in thin laptops |
| AMD Radeon 880M / 890M | main competitors among contemporary iGPUs |
| NVIDIA GeForce RTX 3050 Laptop | faster in gaming, especially at stable power limits |
| NVIDIA GeForce RTX 4050 Laptop | a different class of performance, especially in new AAA titles |
| AMD Radeon RX 6550M | entry-level discrete GPU, generally faster in gaming |
The key takeaway is that the Arc 140T is strong as integrated graphics, but it does not blur the line between iGPUs and discrete GPUs. It can replace a lower-end discrete graphics card in simple scenarios but not in heavy gaming or serious 3D work.
Intel Arc 140T in Gaming
The Intel Arc 140T can be viewed as suitable for 1080p gaming, but with moderate expectations. The best scenarios are esports, older AAA titles, and games with moderate graphical demands at low or medium settings.
| Type of Game | What to Expect from Intel Arc 140T |
|---|---|
| League of Legends, Dota 2, Valorant | 1080p, typically high or medium settings |
| Counter-Strike 2, Fortnite | 1080p, often low or medium settings |
| GTA V, The Witcher 3, older AAA titles | 1080p, medium settings on a well-configured laptop |
| New AAA titles | low settings, upscale, potential compromises on resolution |
| Games with ray tracing | comfortable performance is unlikely |
| Games with XeSS | the best scenario for heavy projects if the base FPS is not too low |
Ray tracing is supported in hardware, but its practical utility is limited. In heavy games, ray tracing significantly burdens integrated graphics. XeSS is more beneficial: upscaling and Frame Generation can improve smoothness in compatible games if the initial frame rate is already at an acceptable level.
Intel Arc 140T vs Intel Arc 140V
The main difference between the Intel Arc 140T and the Intel Arc 140V lies in the platform and efficiency. The Arc 140V is part of the Lunar Lake family and is based on the newer Xe2 graphics architecture. The Arc 140T uses Xe+ and is integrated into Core Ultra 200H, where the overall thermal package is higher and cooling is more important.
The Arc 140V is more interesting for thin laptops, where battery life and stable operation at moderate power consumption are critical. The Arc 140T performs better in chassis where manufacturers do not restrict the H-series processor with stringent power limits.
Comparing the Intel Arc 140T and Intel Arc 140V solely by the number of Xe cores is misleading. They exist in different contexts: the 140V is targeted at energy-efficient devices, while the 140T is designed for the more powerful H-series.
Dependence on Memory and Cooling
The worst-case scenario for Intel Arc 140T is a laptop with slow memory, non-optimized RAM mode, and strict power limits. Intel explicitly notes that Arc graphics in H-systems require at least 16 GB of memory in dual-channel mode and are dependent on OEM configurations.
Before purchasing a laptop with Arc 140T, it is worth checking:
- 16 GB of RAM or more;
- dual-channel memory mode;
- not too thin a chassis;
- reasonable power limits for Core Ultra H;
- up-to-date Intel drivers;
- necessary video outputs and support for external monitors.
For integrated graphics, slow or poorly-configured RAM can be as significant a limitation as inadequate cooling.
Should You Choose a Laptop with Intel Arc 140T?
The Arc 140T is suitable for those looking for a laptop without a discrete graphics card but who do not want weak integrated graphics. It is a viable option for work, video, external monitors, AV1 encoding, light editing, older games, online projects, and 1080p gaming on moderate settings.
For new AAA titles at high settings, demanding ray tracing, stable high FPS, and serious 3D work, it is better to opt for a laptop with discrete GPU. The RTX 4050 Laptop and even the RTX 3050 Laptop remain superior in gaming.
The conclusion is straightforward: the Intel Arc 140T is a successful integrated graphics solution for versatile Core Ultra 200H laptops, but only when configured properly. Dual-channel memory, adequate power limits, and cooling are more important than simply the presence of the Arc name in the specifications.
Basic
Memory Specifications
Display and Media
Theoretical Performance
AI Features
Miscellaneous
Benchmarks
Compared to Other GPU


Share in social media
Or Link To Us
<a href="https://cputronic.com/gpu/intel-arc-140t" target="_blank">Intel Arc 140T</a>