NVIDIA GeForce GTX 970
NVIDIA GeForce GTX 970: 3.5 + 0.5 GB of Memory and Performance in 2026
The NVIDIA GeForce GTX 970 was released in September 2014 for $329 and became one of the most popular graphics cards of its generation. Its performance approached that of the $549 GTX 980, but it soon became clear that its 4 GB of memory operated unevenly: the final 0.5 GB was noticeably slower than the rest. NVIDIA had to correct the specifications after sales had already begun.
Twelve years later, the GTX 970 performs roughly on the level of the GTX 1650. It is still sufficient for older games at 1080p, but its 4 GB of memory and lack of new gaming drivers limit its capabilities.
GTX 970 and GTX 980 Specifications
Both graphics cards are based on the Maxwell architecture and use the GM204 processor manufactured on a 28 nm process. The GTX 970 has some of its compute blocks disabled and a limited memory subsystem.
| Specification | GTX 970 | GTX 980 |
|---|---|---|
| CUDA cores | 1664 | 2048 |
| Texture units | 104 | 128 |
| ROPs | 56 | 64 |
| L2 Cache | 1.75 MB | 2 MB |
| Base clock | 1050 MHz | 1126 MHz |
| Boost | 1178 MHz | 1216 MHz |
| Power consumption | 145 W | 165 W |
| Launch price | $329 | $549 |
Both models received 4 GB of GDDR5 memory and a physical 256-bit bus, but the GTX 970 accesses its memory differently.
Why the Memory Is Divided into 3.5 + 0.5 GB
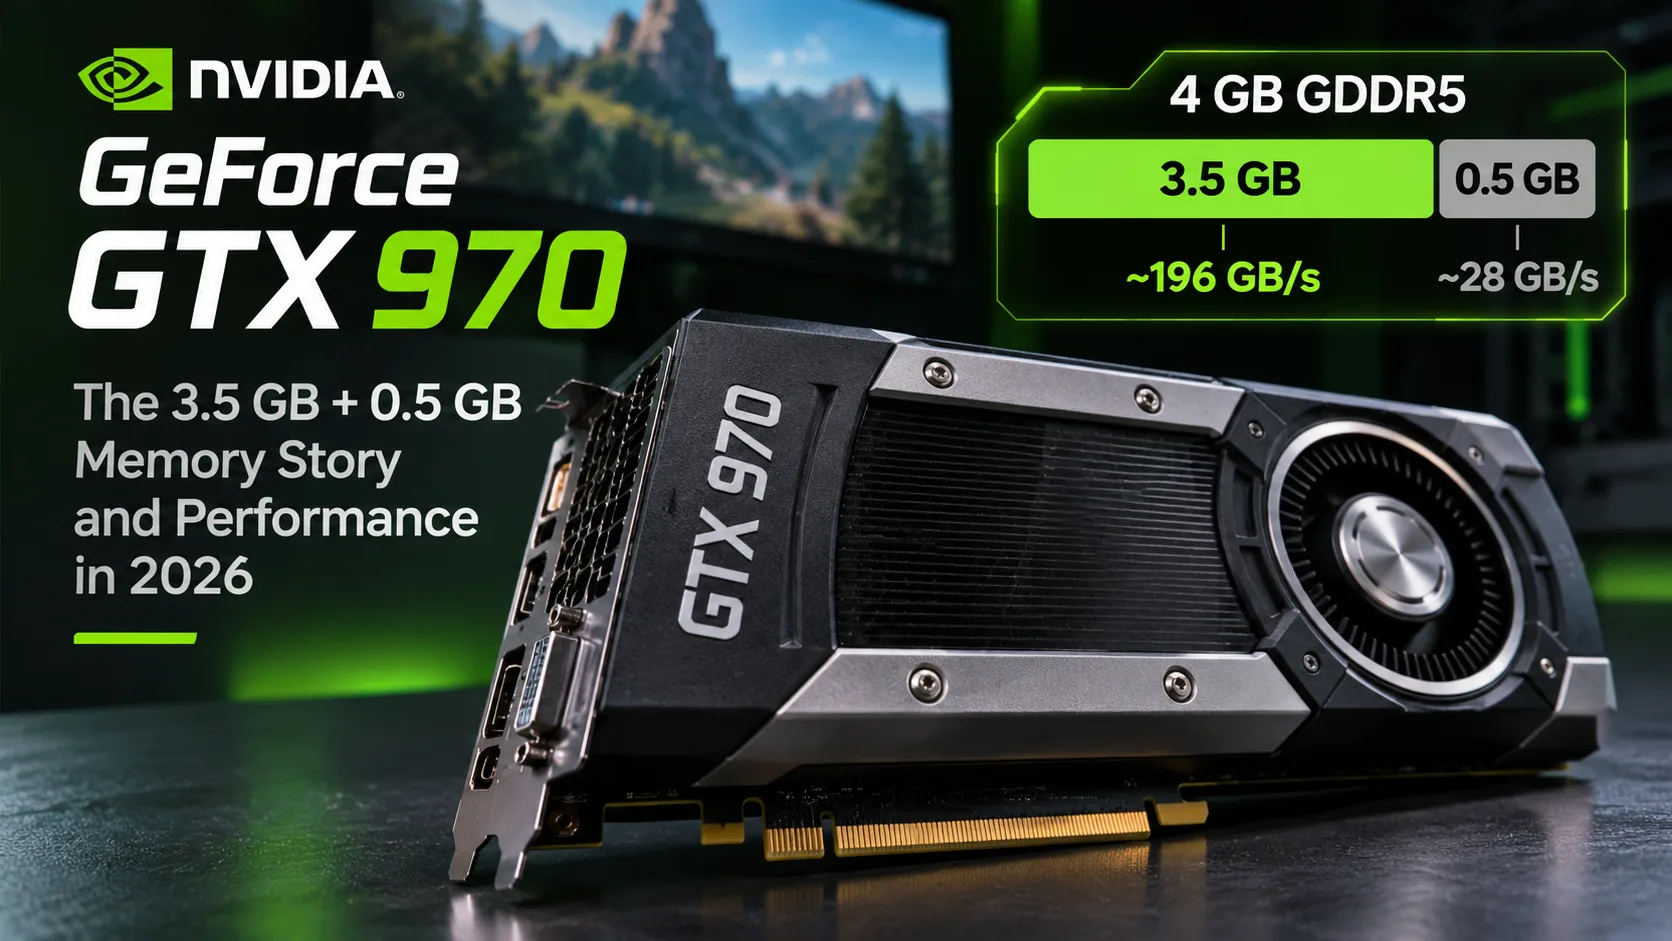
In January 2015, GTX 970 owners discovered a sharp drop in access speed to the final 0.5 GB of video memory. NVIDIA confirmed that, because some of the GM204 blocks were disabled, the memory operated in two segments:
- 3.5 GB - the main segment, with bandwidth of approximately 196 GB/s.
- 0.5 GB - the additional segment, with bandwidth of approximately 28 GB/s.
The driver tries to place the most frequently accessed data in the faster segment. If a game actively accesses the remaining 0.5 GB, latency and FPS drops may occur. However, exceeding 3.5 GB does not always cause noticeable problems: the result depends on how the data is distributed.
At the same time, NVIDIA corrected other specifications: instead of the initially stated 64 ROPs, the GTX 970 had 56, while its L2 Cache was 1.75 MB rather than 2 MB. The card’s actual performance did not change, but the inaccurate specifications prompted complaints from buyers.
Gaming Performance
According to Tom's Hardware test results from 2022-2024, the GTX 970 is practically equal to the GTX 1650 GDDR5. The tests were conducted on a system with a Core i9-12900K and 32 GB of DDR4-3600 memory. The table shows the geometric mean FPS across eight games, including Far Cry 6, Forza Horizon 5, and Red Dead Redemption 2.
| Graphics card | Memory | 1080p Medium, FPS | 1080p Ultra, FPS |
|---|---|---|---|
| GeForce GTX 1050 Ti | 4 GB | 38.0 | 19.8 |
| GeForce GTX 970 | 4 GB | 49.0 | 26.5 |
| GeForce GTX 1650 GDDR5 | 4 GB | 51.3 | 27.0 |
| Radeon RX 570 | 4 GB | 53.6 | 28.1 |
| GeForce GTX 1060 6 GB | 6 GB | 57.7 | 32.1 |
| Radeon RX 6600 | 8 GB | 116.2 | 65.2 |
The GTX 1650 is only 2-5% faster, the GTX 1060 6 GB outperforms the GTX 970 by 18-21%, and the RX 6600 delivers more than double the FPS.
An average of 49 FPS at 1080p Medium makes many games from previous years playable. At Ultra, the figure drops to 26.5 FPS. The situation may be worse in newer games because of memory limitations and their graphics feature requirements.
Drivers and Modern Technologies
In October 2025, NVIDIA stopped releasing Game Ready Drivers for Maxwell. Security updates are scheduled through October 2028, but the GTX 970 no longer receives optimizations for new games.
Main limitations:
- DLSS is not supported. AMD FSR is available in compatible games.
- Ray tracing is not hardware-accelerated because the card has no RT cores.
- CUDA is limited to Compute Capability 5.2. Many modern AI applications are incompatible with it.
- DirectX 12 is supported with a limited feature set, so some newer games may not launch.
Power Consumption and Power Requirements
The GTX 970 consumes up to 145 W according to the reference specifications. NVIDIA recommended a 500 W power supply with two PCIe 6-pin connectors. Requirements may differ for partner models.
For comparison, the GTX 1650 consumes around 75 W at comparable performance, while the RX 6600, with a rated power consumption of 132 W, is more than twice as fast in the tested selection of games. In terms of energy efficiency, the GTX 970 falls noticeably behind newer architectures.
Is the GTX 970 Worth Buying in 2026?
If the GTX 970 is already installed in a computer, it can be kept for older games and less demanding projects. It is not worth buying for a new build.
Replacing it with a GTX 1650 will provide almost no FPS increase, while the GTX 1060 6 GB is also outdated and no longer receives new gaming drivers. For a noticeable performance boost, it makes more sense to consider at least the Radeon RX 6600 class with 8 GB of memory. Newer options include the Radeon RX 7600, GeForce RTX 5060, and Intel Arc B580.
Conclusion: The GTX 970 can still handle many games at 1080p, but its 4 GB of memory is no longer enough for modern titles. The 3.5 + 0.5 GB memory split remains the model’s main technical drawback, although today the total memory capacity and outdated architecture are more significant limitations.
GPU Comparison
Compare GeForce GTX 970 with other GPUs
Basic
Memory Specifications
Display and Media
1x HDMI 2.0
3x DisplayPort 1.2
Theoretical Performance
Miscellaneous
Benchmarks
Compared to Other GPU
Related GPU Comparisons


Share in social media
Or Link To Us
<a href="https://cputronic.com/en/gpu/nvidia-geforce-gtx-970" target="_blank">NVIDIA GeForce GTX 970</a>