AMD Radeon RX 570
Radeon RX 570 in 2026: GTX 1650 Performance at 150 W
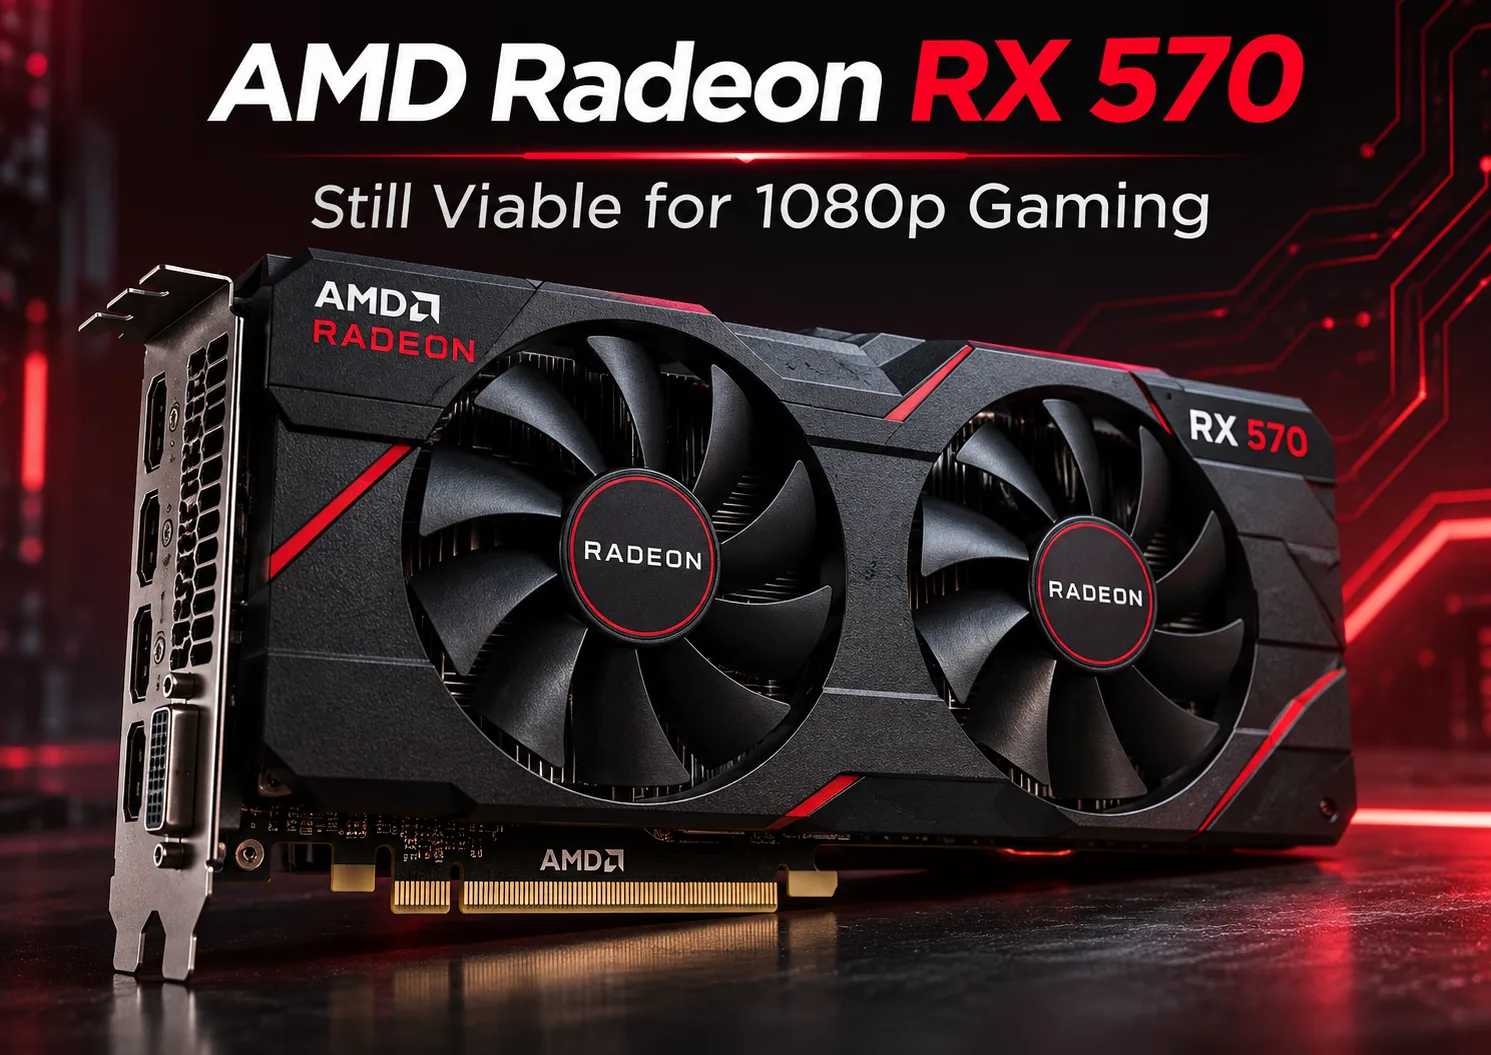
The AMD Radeon RX 570 was released in April 2017, but it can still handle many older games at Full HD. In testing, it delivers around 54 FPS at medium settings, coming very close to the GeForce GTX 1650. However, the RX 570’s rated power consumption is 150 W, compared with 75 W for its competitor, while its 4 GB of video memory limits its capabilities in demanding games.
Nine years later, the RX 570 remains suitable for older computers, but its performance is no longer sufficient for comfortable gaming in many modern titles.
Performance: comparison with competitors
The RX 570 is built on a 14 nm Polaris 20 chip with 2,048 stream processors and 32 compute units. The reference model has a maximum clock speed of 1,244 MHz. Its GDDR5 memory operates over a 256-bit bus with bandwidth of up to 224 GB/s.
The table shows results for seven graphics cards. Gaming results were obtained in eight games from Tom’s Hardware’s 2022-2024 test suite at a resolution of 1920 × 1080. FPS is calculated as the geometric mean. The 3DMark Time Spy Graphics results come from separate comparative testing.
| Graphics card | 1080p Medium, FPS | 1080p Ultra, FPS | 3DMark Time Spy Graphics |
|---|---|---|---|
| Radeon RX 570 4 GB | 53.6 | 28.1 | 3,882 |
| GeForce GTX 1650 4 GB GDDR5 | 51.3 | 27.0 | 3,306 |
| GeForce GTX 1060 6 GB | 57.7 | 32.1 | 4,150 |
| Radeon RX 580 8 GB | 61.7 | 35.3 | 4,416 |
| GeForce GTX 1650 SUPER 4 GB | 67.7 | 33.9 | 4,621 |
| Radeon RX 6600 8 GB | 116.2 | 65.2 | 8,263 |
| Radeon RX 7600 8 GB | 141.4 | 82.0 | 11,007 |
The RX 570 is only 4-5% ahead of the standard GTX 1650 in gaming FPS. At the same time, its rated power consumption is twice as high. The actual difference depends on the graphics card’s implementation and workload.
The RX 580 is 15% faster at medium settings and 26% faster at maximum settings. That gain is too small to justify replacing the RX 570.
The RX 6600 is more than twice as fast with typical power consumption of 132 W. It is not only faster but also more efficient than the older Polaris card. The RX 7600 nearly triples the performance gap at Ultra settings.
What the RX 570 can handle in games
An average of 54 FPS at 1080p Medium looks respectable for a 2017 graphics card. However, the average result hides significant differences between individual games.
For example, testing a Sapphire Nitro+ RX 570 8 GB with a Ryzen 7 2700X processor produced the following results:
| Game | Settings | Average FPS |
|---|---|---|
| Battlefield V | 1080p Ultra | 68 |
| Shadow of the Tomb Raider | 1080p Ultra | 55 |
| Metro Exodus | 1080p Ultra | 31.7 |
These results come from testing 2018-2019 versions of the games. They show that the RX 570 handled some major titles of its time confidently, although even then Metro Exodus had to be run with reduced graphics quality.
In Dota 2, Valorant, and other undemanding online games, the RX 570 is still suitable for Full HD. In Fortnite, it is better to use low settings or a less demanding rendering mode.
The situation is more difficult in Cyberpunk 2077 and Hogwarts Legacy. Low settings and FSR may be required to achieve an acceptable frame rate. The 4 GB version also risks stuttering while textures are being loaded.
1440p makes sense primarily in older and undemanding games. For other titles, it is better to stay at 1080p.
RX 570 with 4 GB and 8 GB: is there a difference?
Both versions use Polaris 20 with the same number of compute units. Cards from different manufacturers may have different clock speeds, but additional memory by itself does not increase the GPU’s computing power.
The 8 GB version is useful in games that require more than 4 GB of video memory. It can reduce the number of accesses to system memory and the associated latency.
If a game is limited by GPU performance, the difference between the versions will be small. For example, increasing the memory capacity does not bring the RX 570 close to the performance of the RX 6600.
For older games, 4 GB is usually sufficient. The 8 GB version is preferable for more demanding titles, although it also does not guarantee smooth operation at high settings.
Power consumption and technical limitations
AMD specifies typical power consumption of 150 W for the RX 570 and recommends a power supply rated at 450 W or higher. Depending on the specific model, the graphics card requires additional power through a 6- or 8-pin connector.
When using an older card, it is worth checking the condition of the cooling system. A clogged heatsink, dried-out thermal paste, or worn fans can lead to overheating and reduced clock speeds.
The Polaris architecture has other limitations as well:
- No hardware ray-tracing accelerators.
- No hardware AV1 encoding.
- No dedicated tensor cores for neural networks.
- Support for modern gaming technologies is limited by the architecture and drivers.
At the same time, the RX 570 supports DirectX 12, Vulkan, FreeSync, and hardware H.264 and H.265 encoding. FSR can be used in compatible games, but upscaling does not always compensate for the lack of performance.
The Adrenalin 26.5.2 driver, dated May 21, 2026, is available for the RX 500 series on AMD’s website. Its release notes mention a fix for a possible Apex Legends crash. However, the availability of updates does not guarantee that new games will be optimized for Polaris.
Is it worth buying a Radeon RX 570 in 2026?
If the RX 570 is already installed in a computer, replacing it for older games is not necessary. It is still suitable for GTA V, Dota 2, and other undemanding titles, especially at 1080p.
Buying an RX 570 for a new system does not make sense. Moving to a GTX 1650 will not provide a noticeable performance increase either, while the RX 580 is too close to it in terms of capabilities.
For a full upgrade, it is better to choose a more modern graphics card. As of early November 2026, new Radeon RX 7600 8 GB cards can be found in U.S. retail for approximately $390 or more, while the GeForce RTX 5060 8 GB starts at $450.
However, owners of older computers need to consider the PCIe interface. The RX 570 uses PCIe 3.0 x16, while the RX 7600 connects over PCIe 4.0 x8. On a motherboard with PCIe 3.0, the newer card will operate with eight third-generation lanes, halving the available bandwidth compared with PCIe 4.0 x8.
In most games, the resulting performance loss is relatively small, but it can increase when video memory is insufficient. An older processor can also limit the FPS gain. Therefore, the nearly threefold advantage of the RX 7600 shown in the table does not guarantee the same result on a decade-old computer.
Conclusion: The Radeon RX 570 is still suitable for older games at Full HD, but its capabilities are limited in modern demanding titles. The 8 GB version handles high video-memory loads better, but it does not solve the problem of a weak GPU. Owners of a working RX 570 can continue using it. When upgrading, it makes more sense to skip the GTX 1650 and RX 580 and move directly to a more powerful architecture.
GPU Comparison
Compare Radeon RX 570 with other GPUs
Basic
Memory Specifications
Display and Media
1x HDMI 2.0b
3x DisplayPort 1.4a
Theoretical Performance
Miscellaneous
Benchmarks
Compared to Other GPU
Related GPU Comparisons


Share in social media
Or Link To Us
<a href="https://cputronic.com/en/gpu/amd-radeon-rx-570" target="_blank">AMD Radeon RX 570</a>