AMD Radeon RX 580

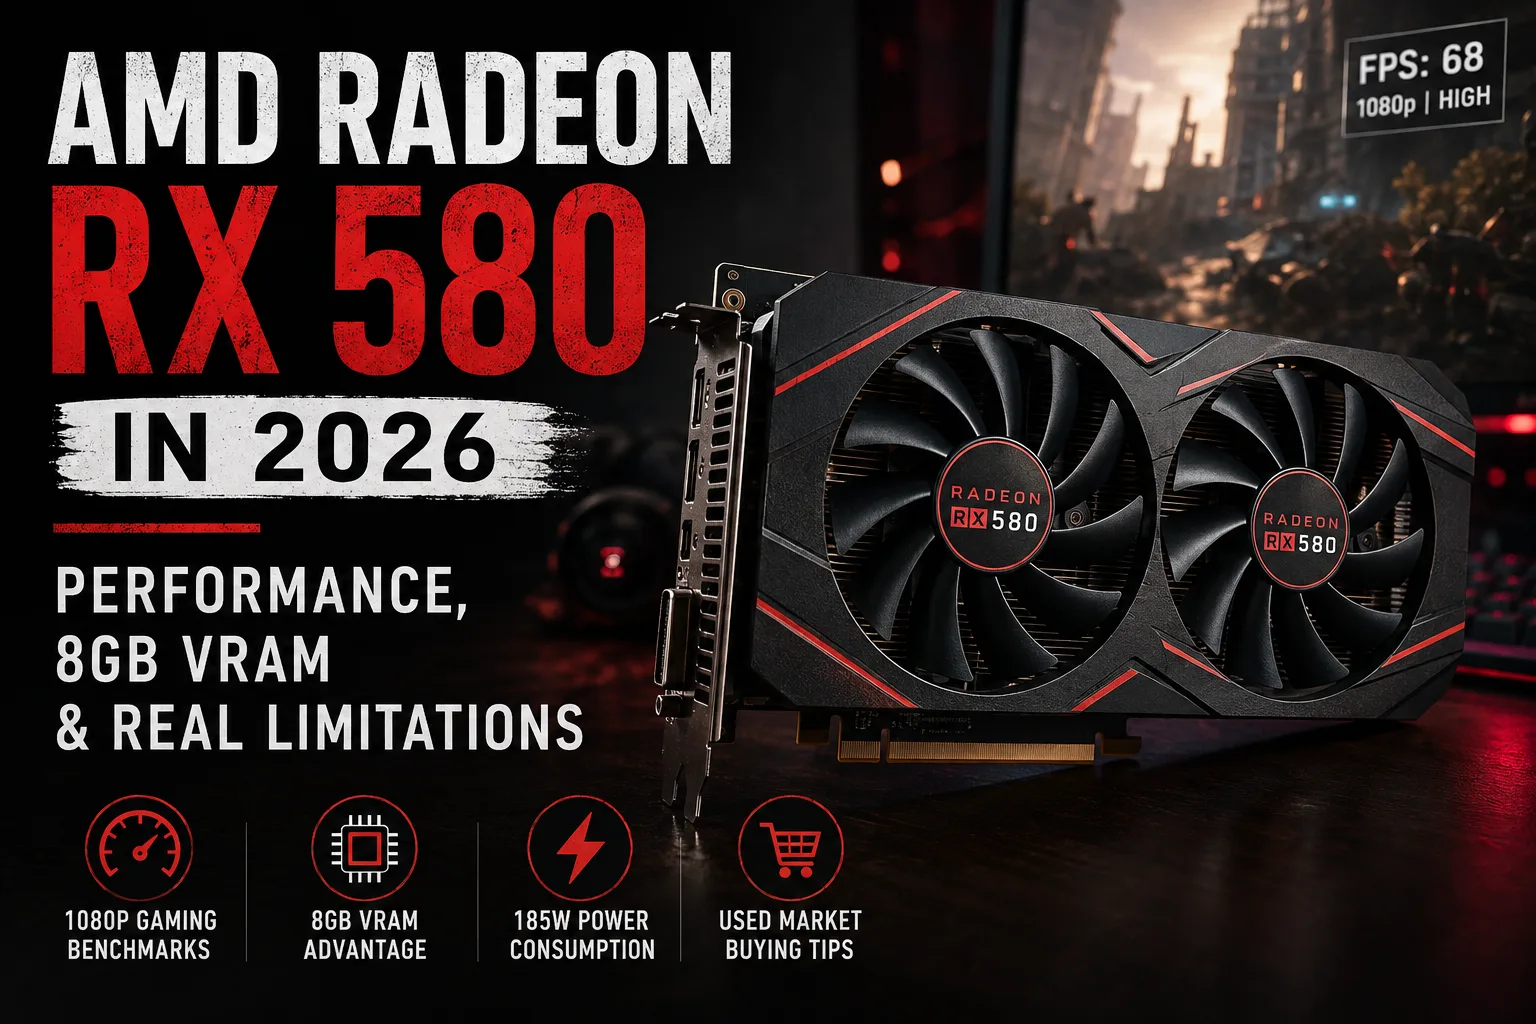
AMD Radeon RX 580 in 2026: Performance, 8 GB Memory, and Real Limitations
The AMD Radeon RX 580 was released in 2017, but it is still found in budget gaming PCs today. The main advantage of the RX 580 today is its 8 GB of video memory and low price on the secondary market, rather than the performance of the Polaris architecture itself. In older AAA games, online projects, and less demanding games at Full HD, it is still sufficient. In new heavy projects, the GPU limitations are already quite noticeable, and when purchasing a second-hand card, the condition of the specific instance is more important than the brand and factory overclocking.
AMD Radeon RX 580 Performance Results in Specific Graphics Cards
| Graphics Card | Video Memory | Boost GPU | 3DMark Time Spy |
|---|---|---|---|
| Sapphire NITRO+ RX 580 Limited Edition | 8 GB | up to 1450 MHz | 4 830 |
| ASUS ROG Strix RX 580 O8G Gaming | 8 GB | up to 1380 MHz | 4 492 |
| XFX Radeon RX 580 | 8 GB | up to 1360 MHz | 4 311 |
The results were obtained on different test benches, so the table shows the operational range of the RX 580 rather than the exact differences between partner versions. Factory overclocking usually provides only a few percentage points. For an older card, the cooling condition, power limits, and temperature under load are more critical than additional tens of megahertz.
RX 580 - Essentially an Overclocked RX 480
The Radeon RX 580 is based on Polaris 20 and is an evolution of the RX 480 rather than a new generation of GPU. AMD increased the clock speeds to achieve a slight performance boost along with increased power consumption.
The full-fledged RX 580 is equipped with 2304 streaming processors and was released with either 4 or 8 GB of GDDR5. Today, it makes sense to look primarily for the version with 8 GB of memory.
What Can the RX 580 Handle in Games
The primary resolution for the RX 580 is 1920×1080. In older AAA games and most online projects, the card still allows for a comfortable frame rate at medium or high settings.
Modern heavy games require many more compromises. Often, it is necessary to lower settings, use scaling, and forgo stable 60 FPS.
At 2560×1440, the RX 580 is already too slow in most demanding games. The limitation here is often the GPU itself, rather than the amount of video memory.
Performance Examples of the RX 580 at 1080p
| Game | Settings | Average FPS |
|---|---|---|
| Doom Eternal | Nightmare | 125 |
| Forza Horizon 4 | High | 88 |
| Death Stranding | Default | 78 |
| Resident Evil Village | Maximum | 72 |
| Shadow of the Tomb Raider | Medium | 62 |
| Star Wars Jedi: Fallen Order | Epic | 61 |
| Watch Dogs: Legion | High | 58 |
The results were obtained on a single test bench with a powerful processor and reflect the level of the GPU itself well. In a specific PC, performance can differ due to the CPU, drivers, clock speeds of the graphics card, and version of the game.
In modern heavy projects, the picture is considerably worse: the RX 580 is now forced to target low or medium settings, and stable 60 FPS are far from guaranteed.
8 GB is Significantly Preferable to 4 GB
The RX 580 with 4 and 8 GB uses the same GPU, so in older games, the difference might be small. But today, 4 GB often limits texture quality and causes data loading issues.
If the price difference is not significant, it is worth choosing the RX 580 8 GB. Additional memory does not make the Polaris faster, but it removes one of the most unpleasant limitations of the 4 GB version.
RX 580 2048SP - Not a Full RX 580
On the secondary market and marketplaces, the Radeon RX 580 2048SP can be found. Despite the name, this is a weaker version and is much closer in configuration to the RX 570.
| Version | Streaming Processors | Typical Memory Speed |
|---|---|---|
| Radeon RX 580 | 2304 | 8 Gbps |
| Radeon RX 580 2048SP | 2048 | 7 Gbps |
The performance of the RX 580 2048SP is lower, so its price should be compared more with the RX 570. Before purchasing an unknown RX 580 from a marketplace, it is advisable to check the number of streaming processors separately.
185 W - Too Much for Such Performance
The typical power consumption of the RX 580 is around 185 W, and some factory versions consume even more. By modern standards, this is one of the card's main weaknesses.
The RX 580 can be very inexpensive, but the high power consumption reduces the appeal of such a purchase. The card requires a proper power supply and a case with sufficient ventilation, whereas newer GPUs can provide comparable or significantly higher performance while consuming less power.
Therefore, paying a large premium for a premium version of the RX 580 today is usually not justified.
On the Secondary Market, the RX 580 Should Be Checked Very Carefully
The RX 580 was one of the popular graphics cards for mining, so it is especially important to check the individual instance on the secondary market. High usage does not in itself mean malfunction, but such cards may have worn fans, dried thermal paste, altered BIOS, or signs of previous repairs.
Before purchasing, one should check:
- temperature under sustained load;
- condition and noise of fans;
- absence of artifacts, crashes, and freezes;
- stability of clock speeds under load;
- originality of BIOS and absence of repair signs.
A card that has been used for mining is not necessarily worse than a gaming one if it operated at stable temperatures and was maintained. The problem lies elsewhere: the usage history of the RX 580 is often unknown, and most instances are already quite old.
For this model, the condition and usage history are now more important than the logo on the cover and factory overclocking.
Modern Capabilities Are Limited by the Polaris Architecture
There is no hardware ray tracing on the RX 580, and the video encoding capabilities and compute blocks are significantly inferior to newer architectures.
8 GB of VRAM help the card remain viable for gaming longer, but do not compensate for the limitations of the Polaris architecture itself. If a new project is too demanding for the RX 580, the additional video memory will not solve the problem.
Is It Worth Buying Radeon RX 580 Today?
The RX 580 makes sense only at a truly low price. Its main niche is a cheap PC for Full HD, older games, online projects, or a temporary graphics card for systems without integrated graphics.
It is best to look for a full RX 580 with 2304 streaming processors and 8 GB of GDDR5. Factory overclocking is secondary: the condition of the board, cooling system, and usage history are more important than an additional 30-100 MHz.
If the RX 580 is significantly cheaper than newer graphics cards, it can still justify the purchase. If the price difference is small, it is better to pay extra for a newer architecture, lower power consumption, and higher performance.
The RX 580 is still capable of decent 1080p performance, but only if it is really inexpensive and the specific instance is in good condition. In 2026, it is the price and condition that determine whether this card makes sense.
GPU Comparison
Compare Radeon RX 580 with other GPUs
Basic
Memory Specifications
Display and Media
3x DisplayPort 1.4a
Theoretical Performance
Miscellaneous
Benchmarks
Compared to Other GPU
Related GPU Comparisons


Share in social media
Or Link To Us
<a href="https://cputronic.com/index.php/gpu/amd-radeon-rx-580" target="_blank">AMD Radeon RX 580</a>