Intel Core i5-1035G1

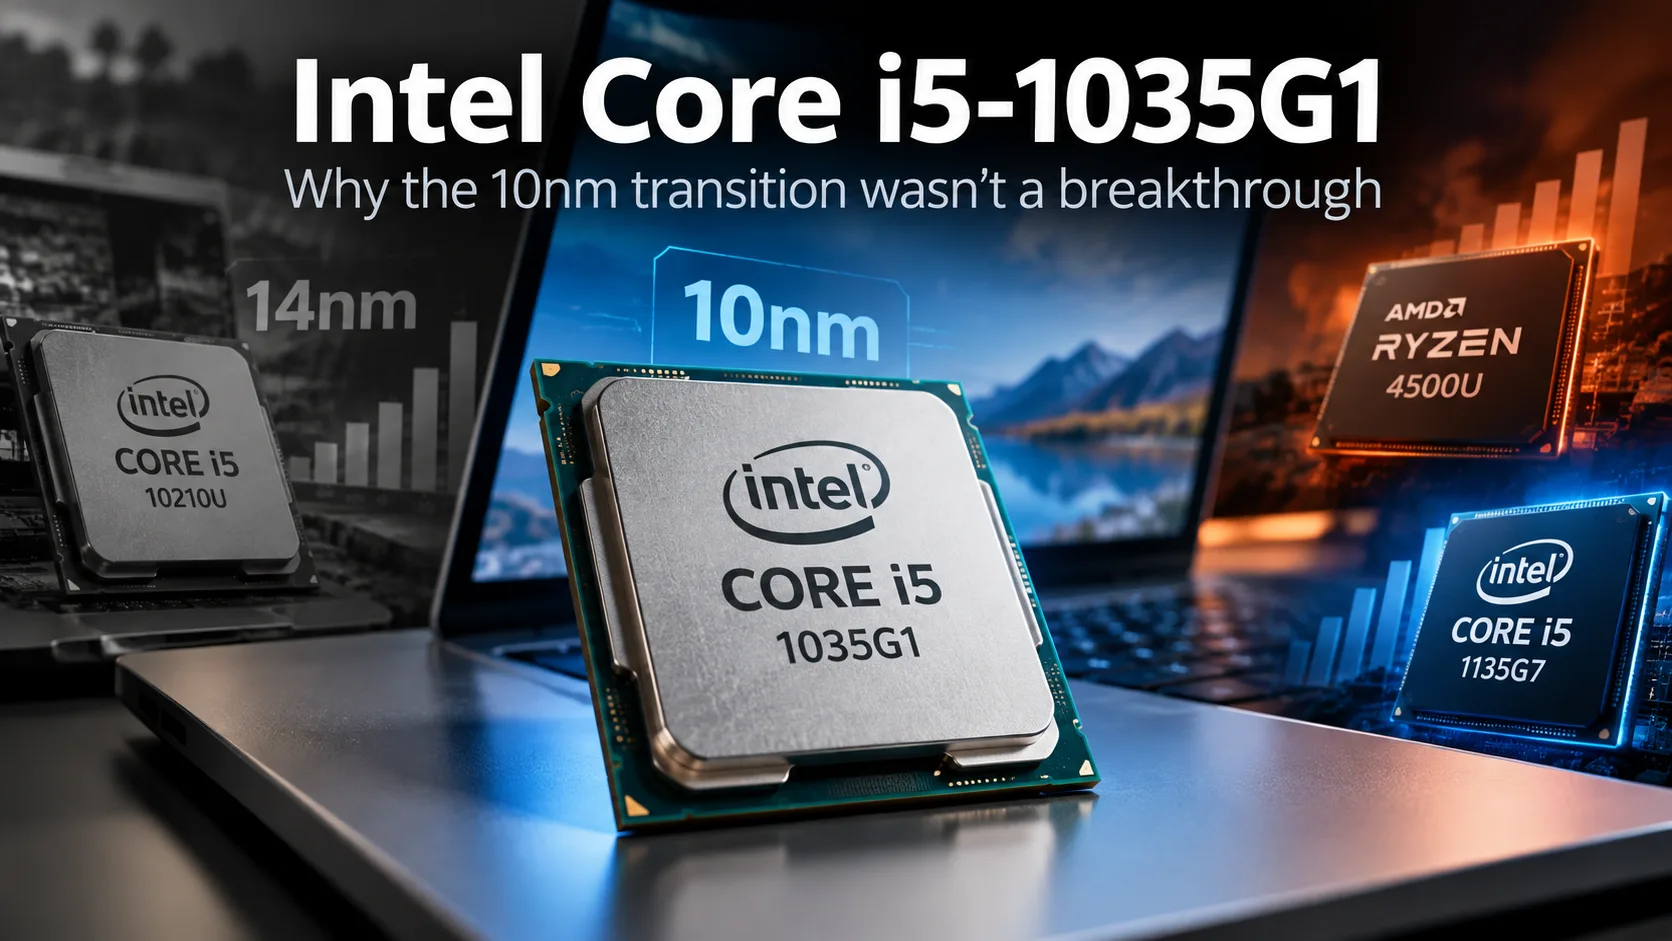
Intel Core i5-1035G1: Why the Move to 10 nm Wasn’t a Breakthrough
The Intel Core i5-1035G1 was released in 2019 and became one of the company’s first mass-market mobile processors built on a 10-nm process. The Sunny Cove architecture increased performance per clock, but the 14-nm Core i5-10210U offset that advantage with higher clock speeds. At the same time, the Core i5-1035G1 itself showed performance differences of up to 59% in multithreaded tests depending on the laptop.
Just a year later, six-core Ryzen 4000 processors surpassed Ice Lake in multithreaded workloads, while Intel Tiger Lake delivered significantly more powerful integrated graphics. In 2026, the Core i5-1035G1 is found mainly in used laptops, where its appeal is determined by the price and the condition of the device.
Ice Lake Architecture: New Cores Versus Higher Clock Speeds
The Core i5-1035G1 features four Sunny Cove cores, eight threads, and 6 MB of L3 cache. The architecture brought improved instruction processing, AVX-512 support, and support for faster DDR4-3200 and LPDDR4-3733 memory.
The main problem was clock speed. Maximum Turbo Boost was limited to 3.6 GHz, compared with 4.2 GHz on the Core i5-10210U with the older Comet Lake architecture. The increase in performance per clock partially offset the clock-speed difference, so Ice Lake failed to significantly outperform Comet Lake.
Both processors are rated at 15 W. Manufacturers could configure the Core i5-1035G1’s TDP within a range of 13-25 W, while the actual power limits depended on the laptop’s design.
Performance: One Processor, Different Results
Cinebench R20
| Laptop and processor | Single-Core | Multi-Core |
|---|---|---|
| Microsoft Surface Laptop Go - i5-1035G1 | 413 | 1,178 |
| Dell XPS 13 9300 - i5-1035G1 | 425 | 1,533 |
| Lenovo IdeaPad 5 15IIL05 - i5-1035G1 | 431 | 1,873 |
| Lenovo IdeaPad S540 - i5-10210U | 425 | 1,416 |
| Microsoft Surface Laptop Go 2 - i5-1135G7 | 506 | 1,519 |
| Lenovo IdeaPad Flex 5 14 - Ryzen 5 4500U | 446 | 2,530 |
The Lenovo IdeaPad 5 scores 59% higher in Multi-Core than the Surface Laptop Go with the same Core i5-1035G1. The difference in Single-Core is just 4%. The Lenovo was tested in high-performance mode and made better use of its available power headroom.
The Core i5-10210U scores 425 points in Single-Core, the same as the Dell XPS 13 with the newer Ice Lake processor. In Multi-Core, the older 14-nm processor falls between the compact Surface and the Dell XPS 13 with the Core i5-1035G1.
The Ryzen 5 4500U, with six physical cores, is significantly faster: the Lenovo IdeaPad Flex 5 outperforms even the most powerful laptop with an i5-1035G1 in the table by 35%.
Geekbench 6
| Processor | Single-Core | Multi-Core |
|---|---|---|
| Intel Core i5-10210U | 1,286 | 3,195 |
| Intel Core i5-1035G1 | 1,534 | 3,555 |
| Intel Core i5-1135G7 | 1,783 | 4,930 |
| AMD Ryzen 5 4500U | 1,491 | 4,717 |
In Geekbench 6, the Core i5-1035G1 outperforms the i5-10210U by 19% in Single-Core and 11% in Multi-Core. Ice Lake’s advantage is more noticeable in the single-core test, while multithreaded performance increased by just 11%.
The Core i5-1135G7 outperforms it by 39% in Multi-Core. The Ryzen 5 4500U trails Ice Lake by 3% in Single-Core but leads by 33% in Multi-Core.
Intel UHD Graphics G1: The Processor’s Weak Point
The integrated UHD Graphics G1 features 32 execution units (EUs) and a clock speed of up to 1.05 GHz. This is the entry-level Ice Lake graphics configuration, while higher-end versions offered 48 or 64 EUs.
A year later, the Core i5-1135G7 received Iris Xe graphics with 80 EUs.
3DMark Night Raid Graphics
| Laptop and processor | Integrated graphics | Score |
|---|---|---|
| Dell XPS 13 9300 - i5-1035G1 | UHD G1 | 7,201 |
| HP Envy x360 15 - Ryzen 5 4500U | Radeon Vega 6 | 12,977 |
| Lenovo Yoga Slim 7 - i5-1135G7 | Iris Xe | 13,652 |
The Radeon Vega 6 outperforms the UHD G1 by 80%, while the Iris Xe leads it by 90%. Integrated graphics performance also depends on system memory bandwidth.
In 2026, the UHD G1 is sufficient for video playback, the Windows interface, and older undemanding games. In modern demanding games, the graphics solution cannot provide a comfortable frame rate even at low settings.
Is It Worth Buying the Core i5-1035G1 in 2026?
Four cores with Hyper-Threading are still sufficient for web browsing, office applications, video calls, and studying. With an SSD and 16 GB of RAM, a laptop can also handle small projects in code editors. Heavy IDEs, multiple Docker containers, and lengthy computations reveal the processor’s limitations more quickly.
When buying a used device, it is worth checking the battery, cooling system, and memory upgrade options. Laptops with the same CPU can differ noticeably in performance, as demonstrated by the results for the Lenovo IdeaPad 5 and Surface Laptop Go.
The Core i5-1035G1 is worth considering if it offers substantial savings compared with models featuring the Ryzen 5 4500U, Ryzen 5 5500U, or Core i5-1135G7.
Conclusion
The Core i5-1035G1 showed that moving to 10 nm does not guarantee a major increase in speed. The Sunny Cove architecture improved single-core performance, but lower clock speeds prevented Ice Lake from pulling significantly ahead of 14-nm Comet Lake.
The very next Intel generation noticeably increased CPU and integrated graphics performance, while six-core Ryzen 4000 processors surpassed Ice Lake in multithreaded workloads. As a result, the Core i5-1035G1 quickly lost its competitiveness despite its new architecture and process technology.
CPU Comparison
Compare Core i5-1035G1 with other CPUs
Basic
CPU Specifications
Memory Specifications
GPU Specifications
Benchmarks
Compared to Other CPU
Related CPU Comparisons


Share in social media
Or Link To Us
<a href="https://cputronic.com/en/cpu/intel-core-i5-1035g1" target="_blank">Intel Core i5-1035G1</a>