NVIDIA GeForce RTX 5080
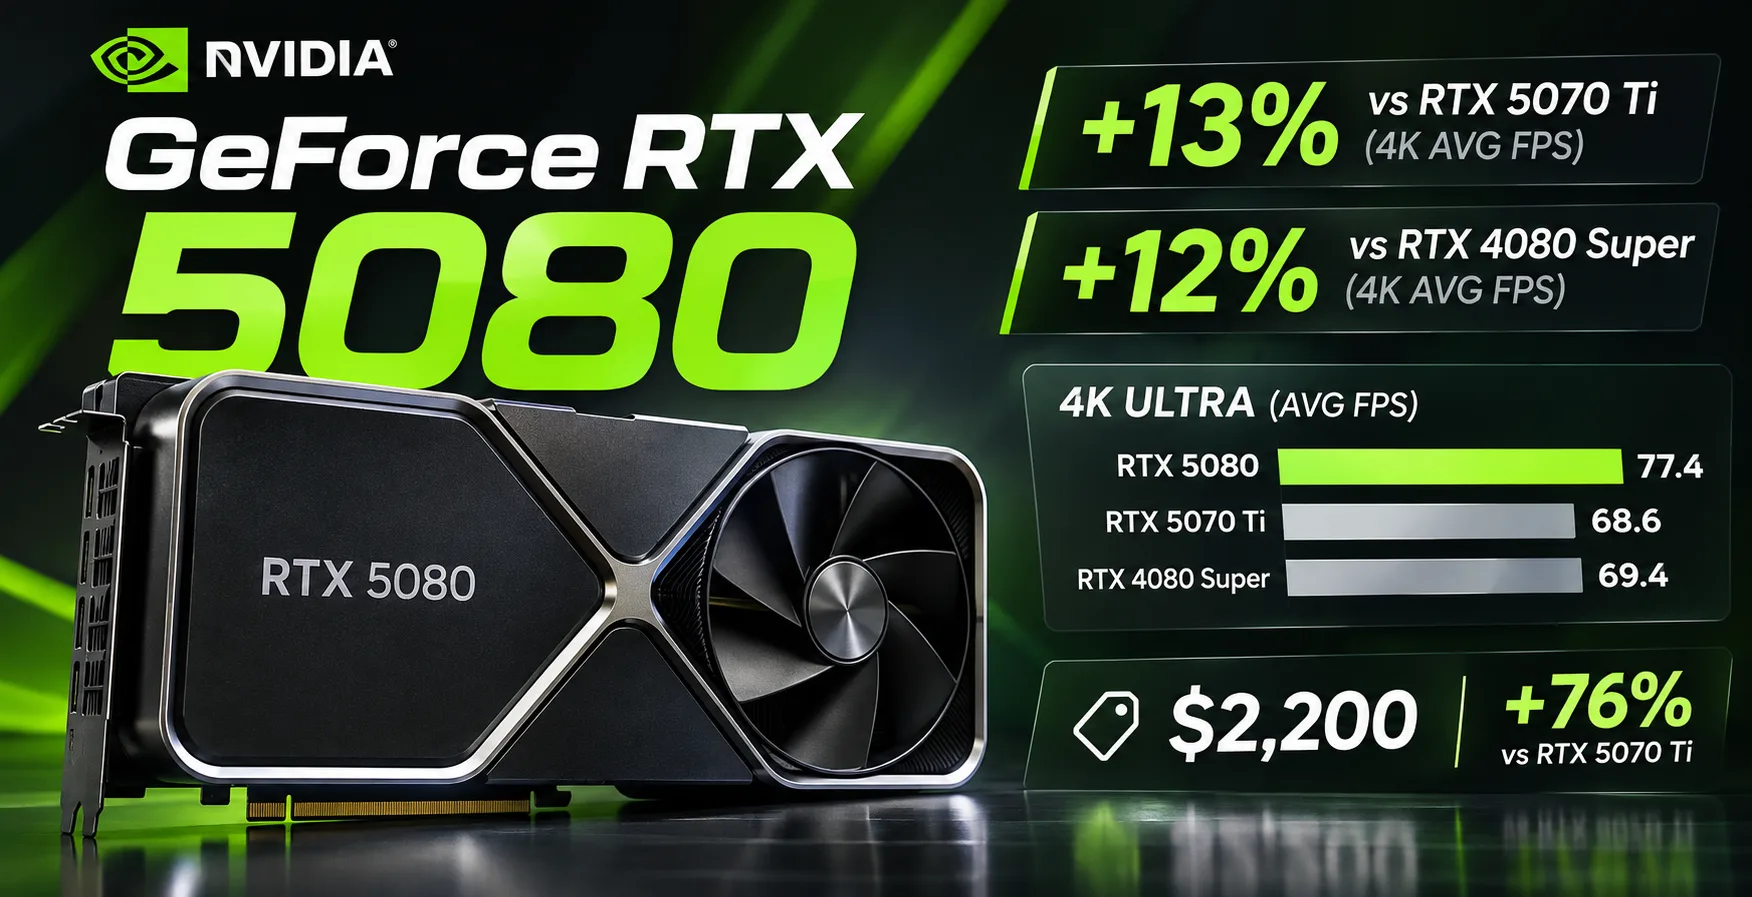
GeForce RTX 5080: 13% Faster Than the RTX 5070 Ti at 4K, but 76% More Expensive
The GeForce RTX 5080 launched in January 2025 at $999, but by October 2026, the lowest price among available offers in the US had reached $2200. Meanwhile, the $1250 RTX 5070 Ti trails it by only 13% on average frame rate at 4K. The price difference is $950, even though both cards have 16 GB of video memory and support DLSS Multi Frame Generation.
The upgrade over the RTX 4080 Super is also modest. According to Tom's Hardware testing, the RTX 5080 is approximately 12% faster than its predecessor at 4K without ray tracing. It shows its most noticeable advantage over the RTX 5070 Ti in games with heavy ray tracing, but even there, the performance gain does not match the price difference.
Blackwell and GDDR7: What Has Changed
The RTX 5080 is built around the GB203 GPU with 10,752 CUDA cores. It uses GDDR7 memory with 960 GB/s of bandwidth instead of the GDDR6X used by the RTX 4080 Super. Memory bandwidth has increased by 30%, but capacity remains unchanged.
| Specification | RTX 5080 | RTX 4080 Super | RTX 5070 Ti |
|---|---|---|---|
| Architecture | Blackwell | Ada Lovelace | Blackwell |
| CUDA cores | 10,752 | 10,240 | 8,960 |
| Memory | 16 GB GDDR7 | 16 GB GDDR6X | 16 GB GDDR7 |
| Bandwidth | 960 GB/s | 736 GB/s | 896 GB/s |
| Boost clock | 2617 MHz | 2550 MHz | 2452 MHz |
| TGP | 360 W | 320 W | 300 W |
The RTX 5080 features fourth-generation RT cores, fifth-generation Tensor cores, PCIe 5.0, and DisplayPort 2.1b.
The nominal TGP has increased from 320 to 360 W, although actual power consumption depends on the workload. NVIDIA recommends an 850 W power supply. Power is supplied through a 16-pin power cable or the included adapter for three 8-pin connectors.
3DMark Time Spy
| Graphics card | Graphics Score |
|---|---|
| GeForce RTX 4090 | 36,676 |
| GeForce RTX 5080 | 31,987 |
| Radeon RX 9070 XT | 29,464 |
| GeForce RTX 4080 Super | 27,920 |
| GeForce RTX 5070 Ti | 27,727 |
ComputerBase results.
The RTX 5080 is approximately 15% faster than the RTX 4080 Super and RTX 5070 Ti, but trails the previous-generation RTX 4090.
Gaming Tests: 1440p and 4K Without Upscaling
Tom's Hardware's aggregate results from June 2026 allow the graphics cards to be compared without DLSS, FSR, or frame generation.
| Graphics card | 1440p Ultra | 4K Ultra | 4K with RT |
|---|---|---|---|
| RTX 4090 | 143.4 | 89.1 | 52.2 |
| RTX 5080 | 128.3 | 77.4 | 42.1 |
| RTX 4080 Super | 118.6 | 69.4 | 38.5 |
| RTX 5070 Ti | 116.8 | 68.6 | 36.7 |
| Radeon RX 9070 XT | 116.5 | 65.8 | 30.1 |
Average FPS. Rasterization and ray tracing were measured in separate game sets.
At 1440p, the RTX 5080 is 10% faster than the RTX 5070 Ti; at 4K, its advantage increases to 13%. The RTX 4080 Super trails the new card by approximately 12% at 4K, while the RTX 4090 retains the lead.
With ray tracing, the RTX 5080's advantage over the RTX 5070 Ti reaches 15%, and its lead over the Radeon RX 9070 XT reaches 40%. However, an average of 42 FPS at 4K with RT means that upscaling or reduced settings will be required for a higher frame rate.
Death Stranding 2: Comparison with DLSS and FSR
ComputerBase's March 2026 tests used very high graphics settings, DLSS 4 Quality for NVIDIA cards, and FSR 4.1 Quality for the Radeon RX 9000. Frame generation was disabled.
| Graphics card | 1440p | 4K | 4K with RT |
|---|---|---|---|
| RTX 4090 | 124.8 | 105.5 | 65.5 |
| RTX 5080 | 125.8 | 96.4 | 57.0 |
| RTX 4080 Super | 104.1 | 82.3 | 49.2 |
| RTX 5070 Ti | 110.4 | 84.6 | 49.2 |
| Radeon RX 9070 XT | 106.9 | 79.0 | 41.2 |
Average FPS. The RT mode uses maximum ray tracing. Image quality may differ between DLSS and FSR.
The RTX 5080 is 14% faster than the RTX 5070 Ti at 4K and 16% faster with ray tracing. The RTX 4090 retains the lead at 4K, although it is slightly behind the new card at 1440p.
Price: How Much Does the Extra Performance Cost?
According to a TechSpot study published on November 2, 2026, the lowest prices of available graphics cards at US retailers during October were $2200 for the RTX 5080, $1250 for the RTX 5070 Ti, and $870 for the Radeon RX 9070 XT.
| Graphics card | US price | FPS at 4K | Price per FPS |
|---|---|---|---|
| RTX 5080 | $2200 | 77.4 | $28.42 |
| RTX 5070 Ti | $1250 | 68.6 | $18.22 |
| Radeon RX 9070 XT | $870 | 65.8 | $13.22 |
Price per FPS is calculated using average 4K Ultra results without ray tracing. This metric is used only to compare the cost of performance.
Per FPS, the RTX 5080 costs 56% more than the RTX 5070 Ti. The Radeon RX 9070 XT offers approximately 85% of the RTX 5080's performance at a price 2.5 times lower.
The RTX 5070 Ti has also become significantly more expensive than its recommended price of $749, but it remains the better-value purchase compared with the RTX 5080.
DLSS and Ray Tracing
The RTX 5080 supports DLSS Multi Frame Generation, which creates additional frames between those rendered by the game engine. The technology improves visual smoothness but does not provide a proportional improvement in control responsiveness.
The RTX 5070 Ti supports the same technology. The RTX 5080's advantage lies in its higher base frame rate, especially in games with path tracing. For owners of high-refresh-rate 4K monitors, this difference may be important, although even the RTX 5080 cannot always avoid upscaling in demanding games.
Blender, Video Editing, and Neural Networks
The RTX 5080 supports CUDA, OptiX, and hardware AV1 encoding. Two ninth-generation NVENC video encoders accelerate the processing of compatible video formats, including 10-bit HEVC 4:2:2.
Puget Systems' Blender Benchmark results are as follows:
| Graphics card | Blender Benchmark |
|---|---|
| RTX 5090 | 15,872 |
| RTX 5080 | 9,035 |
| RTX 5070 Ti | 7,882 |
| Radeon RX 9070 XT | 3,722 |
The RTX 5080 is 15% faster than the RTX 5070 Ti. The Radeon RX 9070 XT falls significantly behind when rendering through HIP, making NVIDIA accelerators preferable for regular Blender work.
For local neural networks, the RTX 5080 is limited by its 16 GB of video memory. For example, a language model with 32 billion parameters and 4-bit quantization will generally not fit entirely within that capacity once auxiliary data and the KV cache are taken into account. Exact requirements depend on the quantization format and context size.
If the model fits in VRAM, the RTX 5080 provides high computational performance. For larger models, additional video memory is often more useful than a faster GPU.
Is the GeForce RTX 5080 Worth Buying in 2026?
At $2200, the RTX 5080 is difficult to recommend for regular gaming. The RTX 5070 Ti costs $950 less, has the same 16 GB of memory, and trails it by only 13% on average FPS at 4K. The Radeon RX 9070 XT offers even better value if high ray-tracing performance is not required.
The RTX 5080 makes sense for 4K gaming with demanding graphics effects, Blender, and CUDA workloads that fit within 16 GB of video memory. Owners of the RTX 4080 Super should not upgrade: an approximately 12% gain at 4K is too small to justify such an expensive replacement.
GPU Comparison
Compare GeForce RTX 5080 with other GPUs
Basic
Memory Specifications
Display and Media
3x DisplayPort 2.1b
Theoretical Performance
Miscellaneous
Benchmarks
Compared to Other GPU
Related GPU Comparisons


Share in social media
Or Link To Us
<a href="https://cputronic.com/index.php/gpu/nvidia-geforce-rtx-5080" target="_blank">NVIDIA GeForce RTX 5080</a>