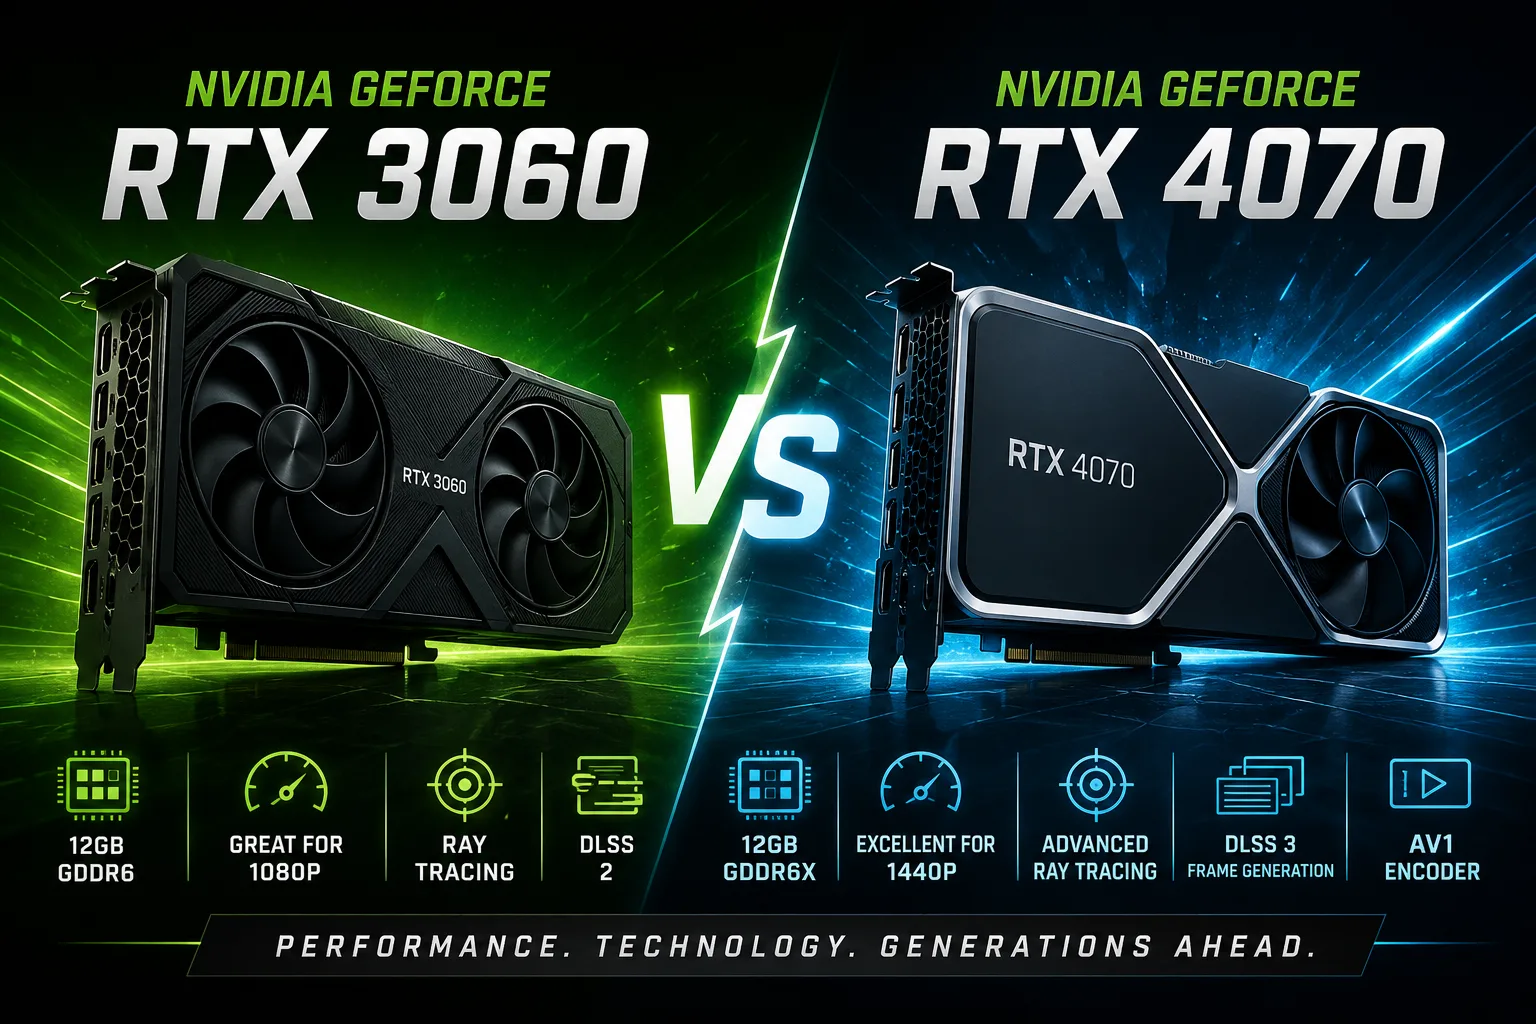
NVIDIA GeForce RTX 3060
vs
NVIDIA GeForce RTX 4070

GPU Comparison Result
RTX 3060 vs RTX 4070: Same 12 GB, But Different Performance Levels
At first glance, when it comes to memory and bus, the RTX 3060 and RTX 4070 appear to be twins: 12 GB, 192-bit. But this resemblance is deceptive. In reality, these cards belong to different weight classes. One remains a popular choice for 1080p gaming, while the other is a solid workhorse for 1440p with a margin for modern technologies. Meanwhile, the RTX 3060 is still significantly more popular: according to the Steam Hardware Survey for May 2026, it occupies 4.19% of the market compared to 1.87% for the RTX 4070.
The key differences between the two generations are summarized in the table below. We are comparing the 12 GB RTX 3060, not the cut-down 8 GB version with a 128-bit bus - the latter is noticeably slower and would only distort the picture.
| Parameter | GeForce RTX 3060 | GeForce RTX 4070 |
|---|---|---|
| Architecture | Ampere | Ada Lovelace |
| CUDA Cores | 3584 | 5888 |
| Boost Clock | 1.78 GHz | 2.48 GHz |
| Memory | 12 GB GDDR6 | 12 GB GDDR6 / GDDR6X |
| Memory Bus | 192-bit | 192-bit |
| RT Cores | 2nd Generation | 3rd Generation |
| Tensor Cores | 3rd Generation | 4th Generation |
| DLSS | DLSS Super Resolution | DLSS 3.5, Frame Generation |
| Video Encoder | NVENC 7th Generation | NVENC 8th Generation, AV1 Encode |
| Power Consumption (TGP) | 170 W | 200 W |
| Target Resolution | 1080p, partially 1440p | 1440p, sometimes 4K with DLSS |
Gaming Performance
According to aggregate testing from NanoReview, the gap in raw FPS is colossal. The RTX 4070 averages 139 FPS compared to 81 FPS at 1080p Ultra, 107 FPS versus 60 FPS at 1440p Ultra, and 62 FPS compared to 32 FPS at 4K Ultra. While these are average figures across a specific set of games, the scale of the gap is evident: the RTX 4070 is 70-90% faster in demanding scenarios. Where the RTX 3060 struggles at 1440p, the RTX 4070 performs confidently, allowing high-refresh-rate monitors to shine in 1080p without compromises.
Tom’s Hardware's June GPU hierarchy also places these cards on different tiers. The RTX 3060 remains in the "affordable Full HD" segment, while the RTX 4070 is firmly established in the "high-end 1440p" category.
Ray Tracing and DLSS: The Difference Beyond FPS
The main advantage of Ada Lovelace is exclusive technologies not available on Ampere. The 3rd generation RT cores provide a noticeable boost in ray tracing, but the real trump card is DLSS 3.5 with Frame Generation. Where the RTX 3060 only relies on upscaling, the RTX 4070 can generate entire frames, dramatically increasing smoothness in story-driven blockbusters. For games like Cyberpunk 2077, Alan Wake 2, and upcoming releases, this difference translates to "playable on medium settings" versus "beautiful, smooth, on high settings."
Moreover, the AV1 encoder makes the RTX 4070 significantly more attractive for streamers and anyone capturing gameplay moments: at the same bitrate, the picture quality is noticeably better than with the RTX 3060's encoder.
Memory: Why "12 GB vs 12 GB" Doesn't Mean Equality
Both cards have 12 GB of memory and a 192-bit bus, which constitutes the main marketing trap. The performance difference is explained not by the amount but by the chip and architecture. The RTX 4070 has many more execution units, higher clock speeds, and significantly improved cache memory (the L2 cache of Ada is much larger). The result is not just an FPS boost but a different level of comfort. On the RTX 3060, it is often necessary to reduce settings at 1440p, not just due to memory limitations but because of a lack of computing power. So, having the same gigabytes doesn’t make the cards equal - it’s a classic case where one should consider the bigger picture rather than just one number.
Power Consumption and Cooling
The TGP for the RTX 3060 is 170 W, while for the RTX 4070 it is 200 W. The difference of just 30 W comes with a double performance advantage (in several scenarios) - this is a huge leap in energy efficiency. Under load, the RTX 4070 stays cooler and quieter, despite delivering significantly more frames. In most models, the fans rarely ramp up to annoying speeds. For builds with a 550-600 W PSU, the RTX 4070 is often the optimal maximum without needing to upgrade the power supply.
Who Should Choose What
Consider the RTX 3060 (12 GB) if:
- Your budget is limited, and the card is available at a reasonable price on the second-hand market;
- Your main monitor is 1080p, and you have no plans to upgrade to 1440p in the next couple of years;
- DLSS Super Resolution meets your needs, and ray tracing is not a priority.
That said, it is essential not to choose the 8 GB version of the RTX 3060 - its reduced bus and lower memory capacity significantly diminish the already limited performance headroom.
The RTX 4070 is a more logical choice if:
- You have a 1440p monitor and want to play on high settings without the hassle of tweaking options;
- Ray tracing is important, and DLSS Frame Generation is seen not as a "crutch" but as a means to get the most out of story-driven games;
- You stream or frequently record videos - the AV1 encoder provides objectively better quality;
- You want a quiet, cool system with headroom for several years ahead. While the card is not ideal for 4K, it can provide acceptable comfort in many projects with DLSS.
Conclusion
The main takeaway is that having the same 12 GB should not mislead you. The RTX 3060 remains a practical budget card for 1080p, while the RTX 4070 represents a genuine leap to a different level of comfort, especially in 1440p. Choosing between them is not a matter of "old versus new" but a conscious decision about what level of performance you truly need.
Advantages
- Higher Boost Clock: 2475MHz (1777MHz vs 2475MHz)
- Higher Bandwidth: 504.2 GB/s (360.0 GB/s vs 504.2 GB/s)
- More Shading Units: 5888 (3584 vs 5888)
- Newer Launch Date: April 2023 (January 2021 vs April 2023)
Basic
Memory Specifications
Display and Media
3x DisplayPort 1.4a
3x DisplayPort 1.4a
Theoretical Performance
Miscellaneous
Benchmarks
Related GPU Comparisons


Share in social media
Or Link To Us
<a href="https://cputronic.com/gpu/compare/nvidia-geforce-rtx-3060-vs-nvidia-geforce-rtx-4070" target="_blank">NVIDIA GeForce RTX 3060 vs NVIDIA GeForce RTX 4070</a>